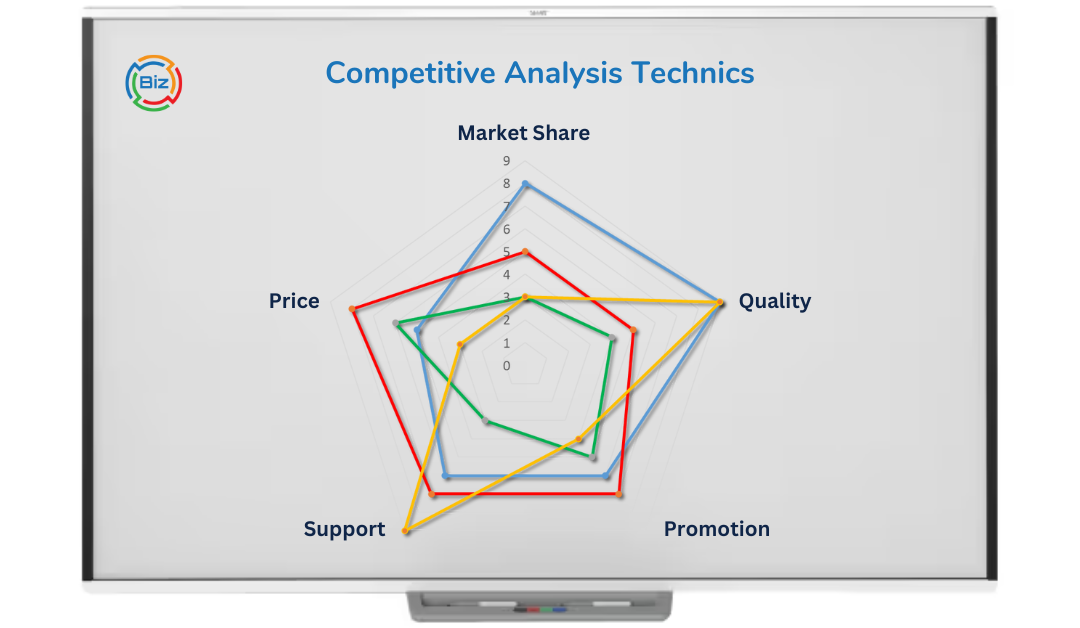
The competitive analysis methodology depicted in the spider chart encompasses a holistic approach to evaluate a company’s standing against its competitors across multiple key performance indicators (KPIs). This methodology, often employed in strategic management and marketing, allows for a direct visual comparison of different entities based on attributes such as Quality, Promotion, Support, Pricing, and Penetration. The spider chart’s main advantage is its ability to display complex multi-dimensional data in a two-dimensional graph, allowing for immediate visual interpretation of a company’s competitive strengths and weaknesses.
Methodology and Considerations
The chart’s axes represent different criteria deemed crucial for market success, and each competitor is plotted against these axes, creating a ‘web’ that visually represents the extent of their market capabilities. The larger the area covered by a competitor’s web, the stronger their market position is considered to be. While creating such a chart, it is essential to ensure that the data is accurate, current, and comparable. Each axis must have the same scale for the results to be meaningful. Moreover, it’s important to consider whether all relevant factors are included and to contemplate assigning different weights to each axis based on their strategic importance.
Advantages over Other Models
When compared to other analytical frameworks like Porter’s Five Forces, SWOT Analysis, and Perceptual Mapping, the spider method analysis stands out for its immediate comparative visuals. Unlike Porter’s Five Forces, which provides an industry-level analysis focused on competitiveness and profitability, the radar chart offers a direct competitor-to-competitor comparison. It allows a company to measure itself against peers on specific attributes rather than on broader industry forces.
Similarly, while SWOT Analysis helps identify internal strengths and weaknesses and external opportunities and threats, it does not inherently provide a direct mechanism for competitor comparison. The spider methodology complements SWOT by translating some of the SWOT components into quantifiable metrics that can be compared across competitors.
Lastly, Perceptual Mapping positions products or companies within a market space to visualize their standing against consumer perceptions on key attributes. While perceptual maps are valuable for understanding positioning in the customer’s mind, they do not necessarily reflect the actual market performance or capabilities of a company. The spider chart, on the other hand, provides an operational view that is based on actual performance data rather than perceptions.
Conclusion
In conclusion, while each analytical tool has its unique strengths, the Spider Analysis Methodology chart offers a clear, concise, and comparative view of where a company stands in direct competition with others. It is especially useful in a multi-attribute competitive landscape and can be a powerful tool when combined with other strategic frameworks to inform decision-making. Its visual nature aids in quickly highlighting areas of competitive advantage and disadvantage, allowing for strategic adjustments that are data-driven and targeted.